
LMS reports are the structured data outputs a learning management system generates about learner activity, progress, assessment performance, and program effectiveness. Most L&D teams pull reports because someone asks for them. A compliance audit requires certification proof. A stakeholder wants to see completion numbers. A quarterly review needs a training summary slide.
This reactive approach turns reporting into a bureaucratic exercise. The data exists, but it does not inform decisions. Reports get exported, formatted, presented, and forgotten. The programs they describe continue unchanged.
The difference between teams that improve training outcomes and teams that repeat the same mistakes is not better content or bigger budgets. It is systematic use of reporting data to identify what works, what fails, and what needs structural adjustment. This guide covers the ten reports that matter most and how to use them.
Why LMS Reporting Matters Beyond Compliance
Compliance training is where most organizations start with LMS reporting, and where many stop. Regulatory requirements create a clear mandate: prove that employees completed specific training by specific deadlines. The reports serve an audit function. They confirm adherence to external requirements.
That function is necessary but insufficient. When reporting serves only compliance, L&D teams lose visibility into the questions that determine whether training actually works. Are learners developing the skills programs target? Where do people disengage? Which courses produce measurable behavior change and which produce only completion metrics?
Strategic LMS reporting answers these questions. It links training activity to learning outcomes and business performance, exposing patterns that aggregate averages hide: cohort-wide drop-off points, assessment items that fail to differentiate skill levels, content sequences that reliably outperform others.
Organizations that treat reporting as a diagnostic tool rather than a compliance artifact make better decisions about where to invest in employee development. They retire underperforming programs faster. They scale what works with evidence instead of intuition.
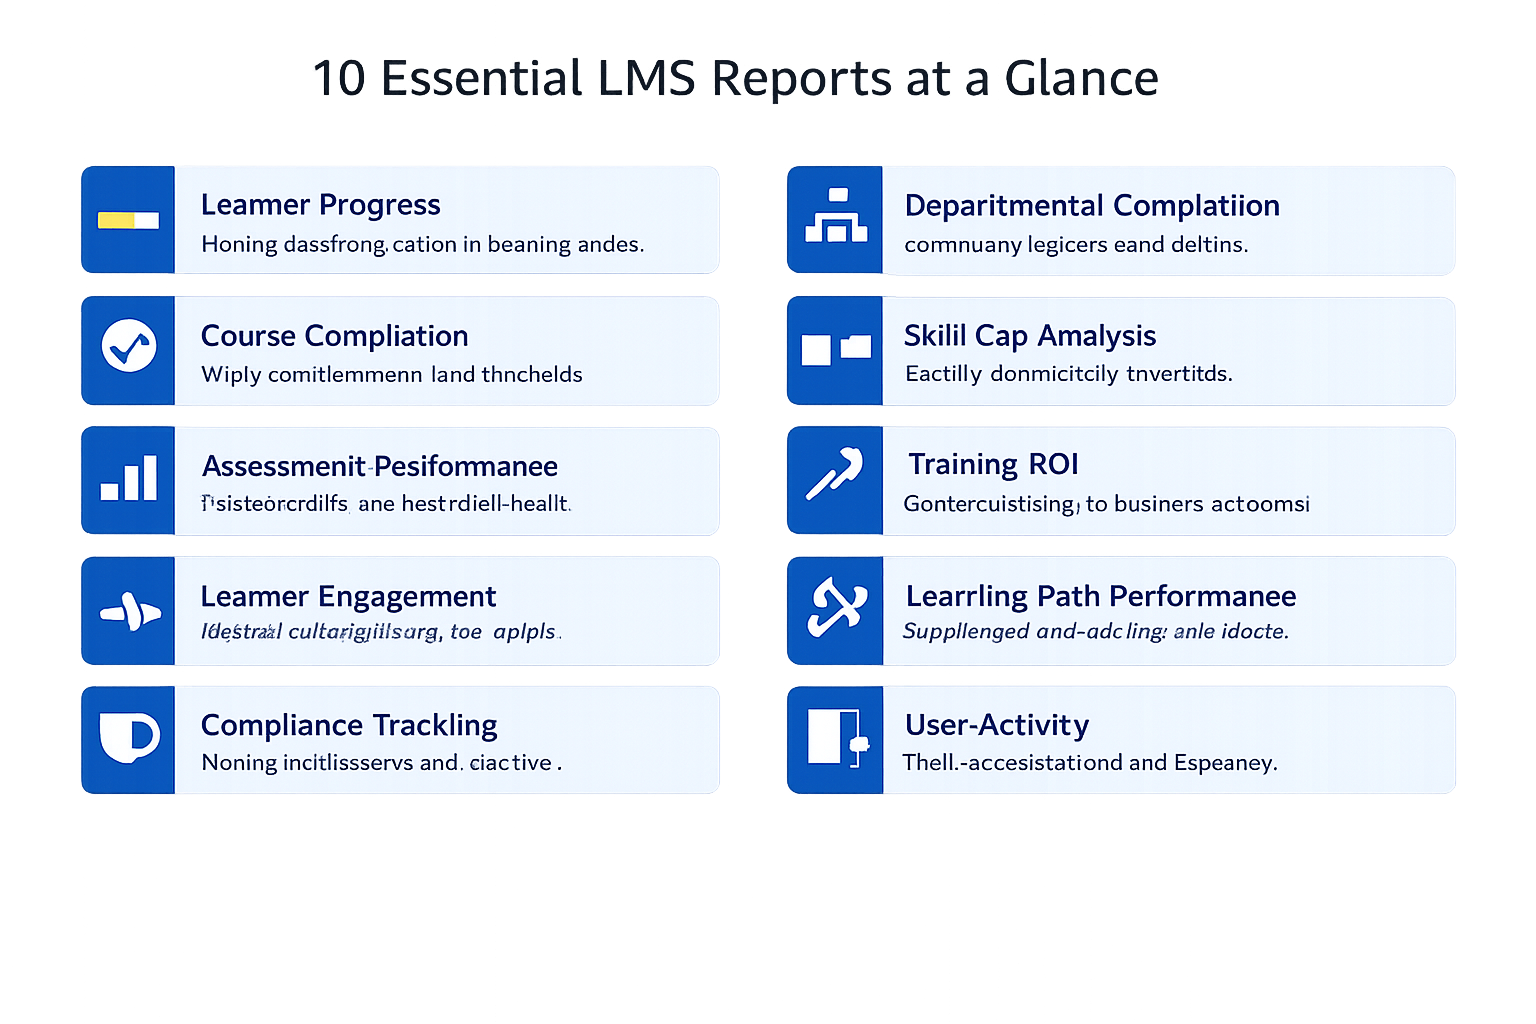
10 Essential LMS Reports Every L&D Team Needs
The reports below span the full lifecycle of a training program, from enrollment and engagement through assessment, completion, and impact. Each one answers a specific operational or strategic question.
Learner Progress Report
The learner progress report tracks where each individual stands within assigned courses and learning paths. It shows modules started, modules completed, current position in a sequence, and time elapsed since last activity.
This report matters because stalled learners are invisible without it. A dashboard showing 60% average progress across a program masks the reality that some learners finished weeks ago while others have not logged in since enrollment. Progress reports surface the distribution, not just the average. L&D teams use them to trigger interventions: reminder sequences for inactive learners, manager notifications for at-risk employees, and facilitator outreach for those stuck at specific content points.
Course Completion Report
The course completion report records which learners finished which courses, when they completed them, and whether they met required thresholds. It is the most commonly pulled LMS report and the foundation for compliance verification.
Beyond compliance, completion data reveals structural issues in program design. Courses with completion rates consistently below organizational benchmarks warrant investigation. The cause may be content quality, unclear prerequisites, excessive length, or poor instructional design. Comparing completion rates across cohorts, departments, or delivery formats identifies where the friction exists.
Assessment Performance Report
Assessment reports show scores, pass/fail rates, attempts per question, and performance distribution across learner populations. They answer whether training is producing the knowledge and skill gains it targets.
Item-level analysis is where this report becomes most useful. Questions that nearly everyone answers correctly are not differentiating skill levels. Questions that nearly everyone answers incorrectly may indicate poor instruction rather than learner deficiency. A well-designed competency assessment produces a distribution that reflects genuine variation in understanding, and the assessment report reveals whether that distribution exists.
Learner Engagement Report
Engagement reports track behavioral signals beyond completion: time spent per module, login frequency, content interaction patterns, discussion participation, and resource downloads. They measure whether learners are actively processing material or clicking through it.
Low engagement with high completion is a warning sign. It suggests learners are satisfying requirements without genuine learning. This pattern often appears in mandatory training where the incentive structure rewards speed over depth. Engagement data helps L&D teams distinguish between programs that develop skills and programs that produce employee engagement theater.
Compliance and Certification Tracking Report
This report monitors regulatory and organizational training requirements: who holds current certifications, whose certifications are approaching expiration, and who has overdue mandatory training. It is the primary report for audit readiness.
The operational value extends beyond audits. Certification tracking feeds workforce planning by identifying upcoming gaps in qualified personnel. When integrated with role assignment data, it flags teams or locations where compliance coverage is thin before it becomes a liability. Automation of expiration alerts and re-enrollment triggers reduces manual tracking overhead.
Training Completion by Department or Team
Departmental reports aggregate completion and progress data by organizational unit. They show which teams are keeping pace with training expectations and which are falling behind.
This report is essential for accountability. When training responsibility is distributed across managers, departmental comparison makes the variation visible. It also surfaces systemic issues: a department with persistently lower completion rates may face workload constraints, scheduling conflicts, or a manager who deprioritizes development. The report does not explain why performance differs, but it locates where investigation should begin.
Skill Gap Analysis Report
The skill gap report compares current competency levels against target proficiency standards for each role or function. It identifies where the workforce falls short and quantifies the distance between present state and desired state.
This report grounds training needs analysis in evidence rather than assumption, converting abstract development goals into measurable gaps. L&D teams can then prioritize content and resources toward the deficiencies the data confirms rather than the ones they presume exist. Platforms that support structured assessment and competency tracking make the analysis more reliable by tying learner performance directly to defined skill frameworks.
Training ROI and Effectiveness Report
The effectiveness report maps training activity to business outcomes: performance improvements, error reduction, productivity gains, customer satisfaction changes, or revenue impact attributable to learning programs.
Building this report requires a measurement framework. The Kirkpatrick model provides a structured approach, evaluating training across four levels: reaction, learning, behavior, and results. Most organizations measure the first two levels well (learner satisfaction and knowledge gains) but struggle with levels three and four (on-the-job behavior change and business impact). The effectiveness report forces L&D teams to define success criteria before programs launch and to collect the data needed to evaluate against those criteria.
Learning Path Performance Report
Learning path reports evaluate how learners move through multi-course sequences designed to build progressive competency. They show where learners advance smoothly, where they stall, and where they abandon the path entirely.
Sequence-level analysis exposes design problems that individual course reports cannot show. A path may contain five courses with acceptable completion rates in isolation, but the transition from course three to course four loses 40% of learners. That transition point, not any single course, is where the design fails. Path performance data guides revision of prerequisites, content sequencing, and pacing structures, the kind of adjustment that is impossible to make without sequence-level visibility.
User Activity and Login Report
The login report tracks access patterns: when learners log in, how often, session duration, and device type. It is the most basic behavioral report and the starting point for understanding how learners interact with the platform.
Activity data informs operational decisions. If 70% of learning happens on mobile devices, content must be mobile-optimized. If login patterns cluster around specific days or times, scheduling live sessions or deadlines around those windows improves participation. Low login frequency across an entire population may indicate platform usability issues, poor program marketing, or lack of manager reinforcement rather than learner motivation problems.
How to Act on LMS Report Data
Pulling reports is the easy part. Acting on them is where most L&D teams stall. Reports accumulate in shared drives. Dashboards get built and bookmarked but never reviewed systematically. The gap between data availability and data-driven decision-making is an operational problem, not a technical one.
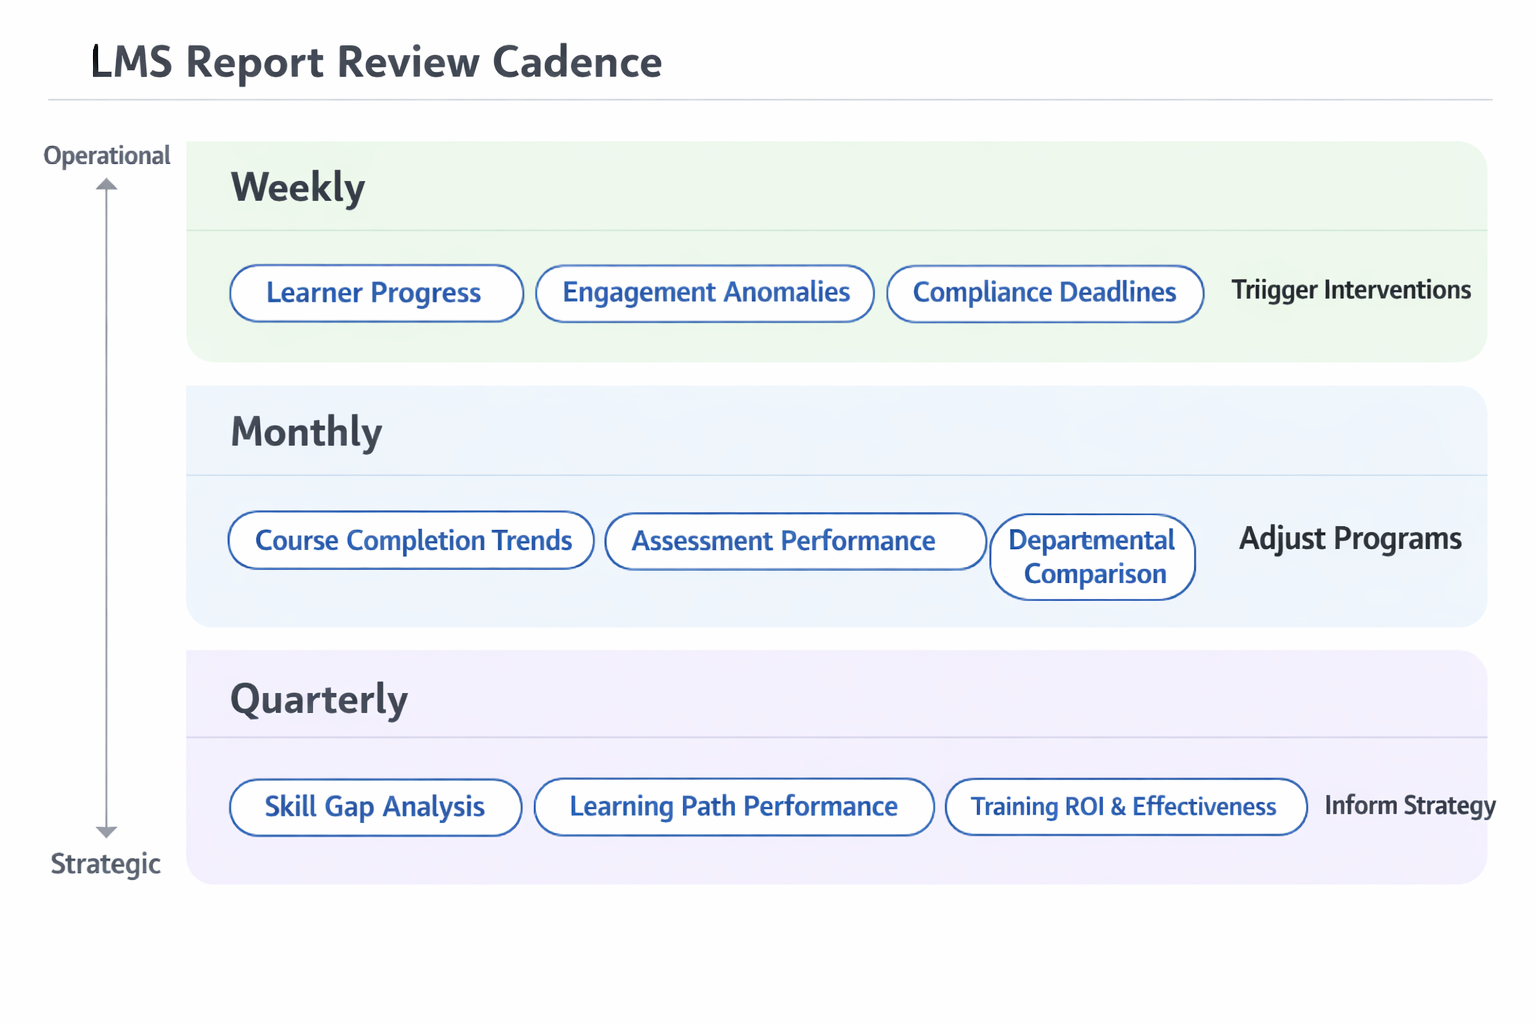
Close that gap with a structured review cadence. Weekly operational reviews should cover learner progress, engagement anomalies, and compliance deadlines. Monthly program reviews should examine completion trends, assessment performance, and departmental comparisons. Quarterly strategic reviews should address skill gap analysis, learning path performance, and training effectiveness against business outcomes.
Each review should produce specific decisions, not observations. If the assessment performance report shows a question cluster where 80% of learners fail, the decision is to revise the instructional content preceding those questions, not to note the finding for future consideration. If the departmental report shows one team consistently lagging, the decision is to investigate root causes with that team's manager within a defined timeline.
Connect reporting to program iteration. Every training program should have defined metrics and a review trigger. When metrics fall below thresholds, the program enters revision. When metrics exceed targets, the program becomes a candidate for scaling. This creates a feedback loop that turns data into design decisions rather than documentation.
Establish clear ownership. Every report needs an owner responsible for reviewing it at the defined cadence, identifying actionable findings, and driving follow-through. Without ownership, reporting becomes documentation rather than a management tool.
Common Reporting Mistakes to Avoid
Measuring activity instead of outcomes. The most common mistake is tracking what is easy to count rather than what matters. Logins, completions, and seat time measure activity. They do not measure learning. A program with 95% completion and zero behavior change is not successful. Align metrics to the outcomes training is designed to produce, and use frameworks from established research like Bersin's learning measurement methodology to guide what to track.
Reporting without context. A 70% completion rate means nothing in isolation. Is the benchmark 60% or 90%? Is the program mandatory or elective? Is the learner population new hires or tenured staff? Reports need baselines, benchmarks, and segmentation to produce meaning. Without context, data invites misinterpretation.
Ignoring qualitative data. LMS reports track numbers, rates, and scores. They do not capture why learners disengage, what content felt irrelevant, or which activities produced genuine insight. Pairing report data with learner feedback, manager observations, and facilitator input fills that gap. Neither source is sufficient on its own; quantitative data shows what happened, while qualitative data explains why, a distinction ATD's research on learning analytics consistently underscores.
Over-reporting. More reports do not mean better insight. Teams that generate dozens of reports create noise that obscures signal. Focus on the reports that answer your most important questions. A focused set of ten reports reviewed consistently outperforms fifty reports reviewed sporadically.
Failing to close the loop. The most damaging mistake is pulling reports that surface real problems and then doing nothing. Reporting without action teaches the organization that data does not matter. Over time, stakeholders stop requesting reports, and L&D loses the analytical credibility needed to influence resource allocation and program strategy.
Final Thoughts
LMS reports are not administrative outputs. They are diagnostic instruments that reveal whether training programs are achieving what they were designed to achieve. The ten reports outlined here cover the full spectrum from operational tracking to strategic evaluation.
The value does not come from the reports themselves. It comes from the decisions they inform and the actions those decisions produce. An L&D team that reviews five reports consistently and acts on every finding will outperform a team with access to fifty dashboards and no decision-making process built around them.
Start with the reports that address your most pressing gaps. If compliance is at risk, prioritize certification tracking and departmental completion. If program quality is the concern, focus on assessment performance and learning path data. If executive alignment is the goal, build the training effectiveness report first. Match your reporting investment to the questions your organization needs answered, then build the review cadence and ownership structures that turn data into improved outcomes.


