Know what's working, and what needs attention.
Track completion rates, score trends, and engagement, from program-wide down to a single learner.
Used by hundreds of teams shaping how the world learns


What analytics shows you.
Completion rates, engagement patterns, and learner outcomes, visible in real time.
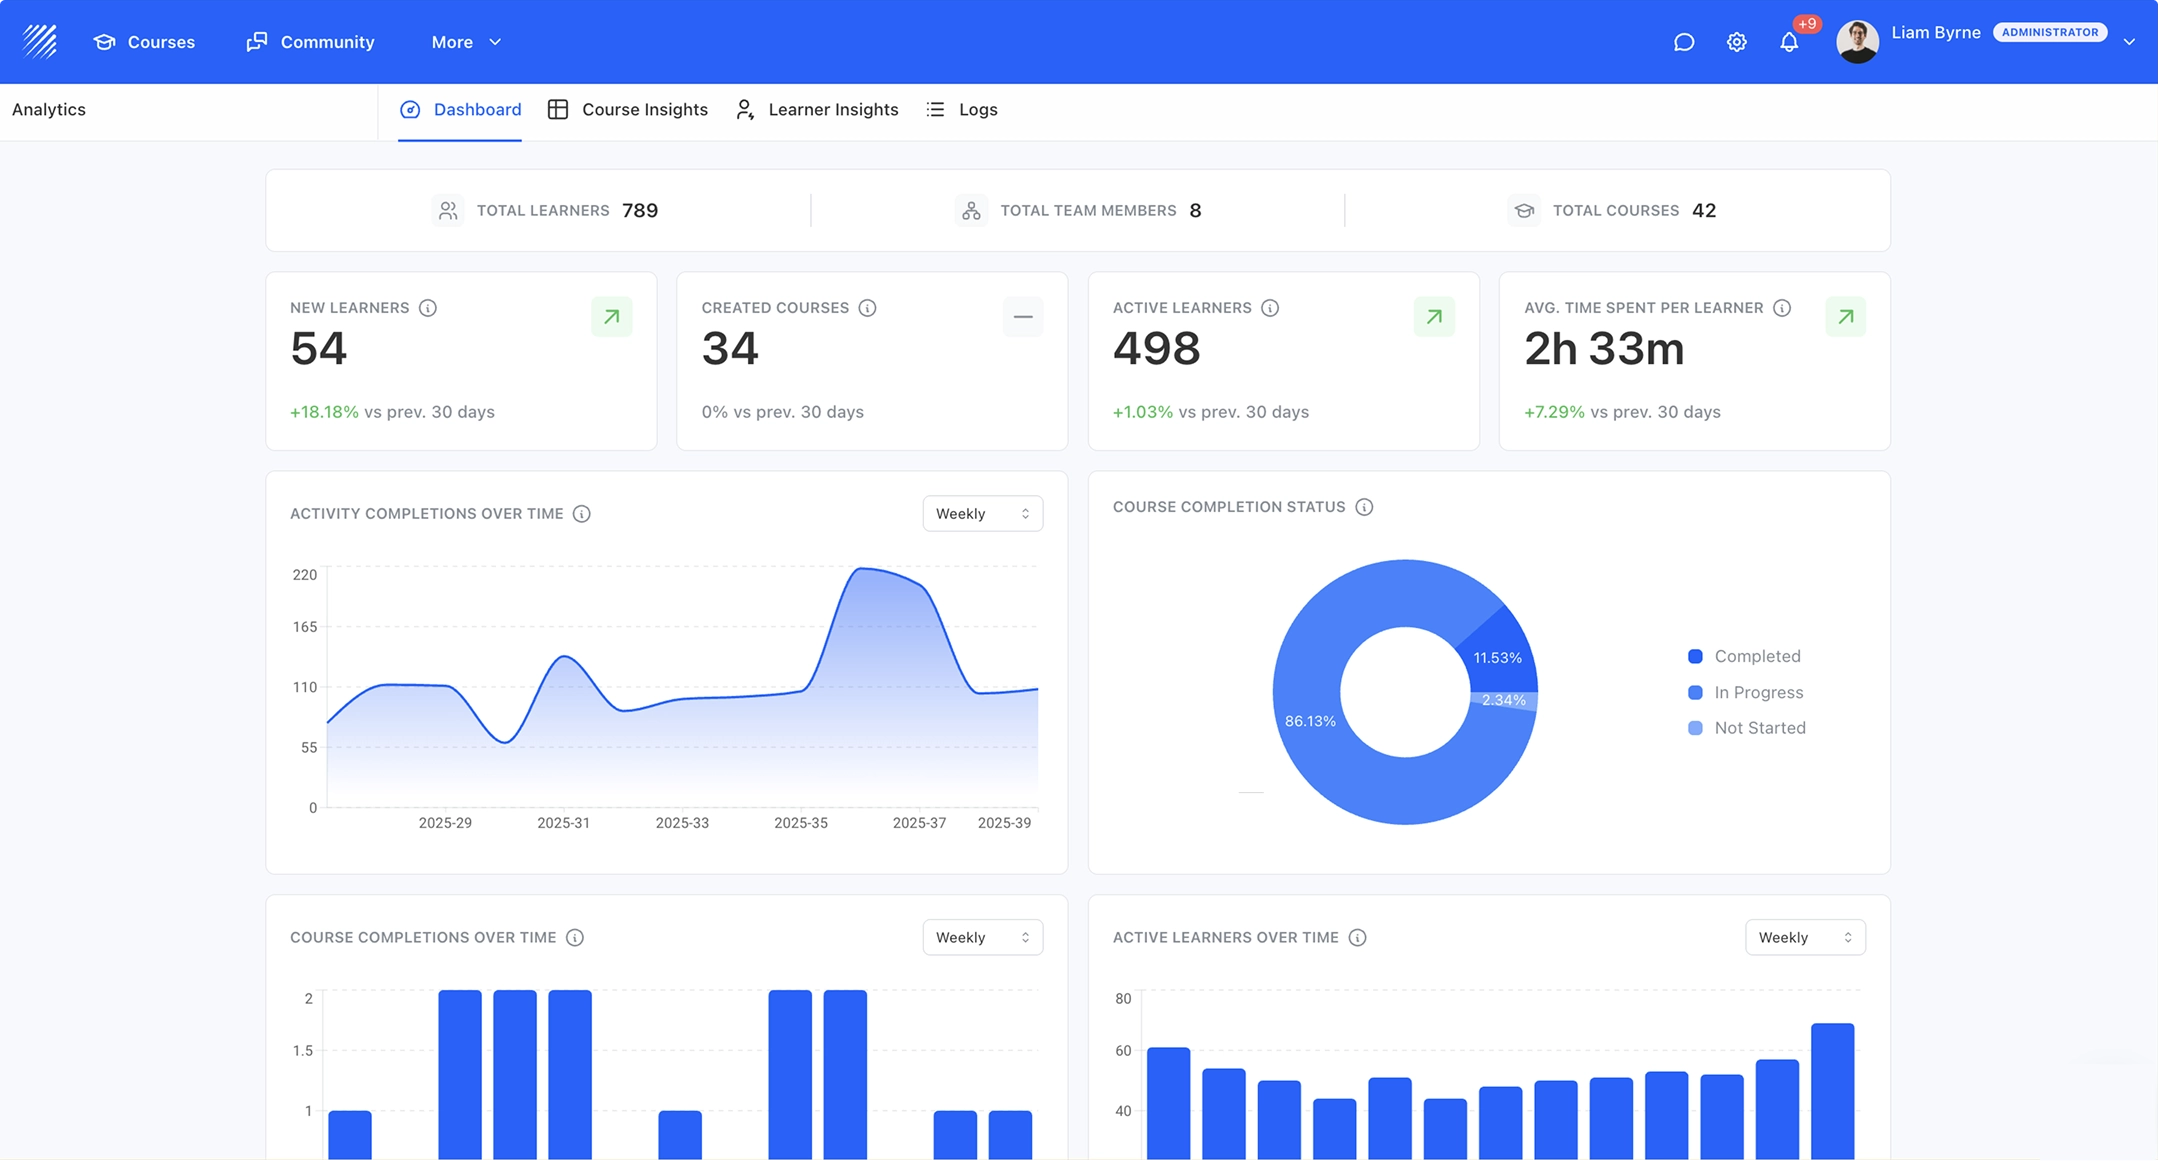
See completion and engagement at a glance
Dashboard views show course completion rates, activity participation, and time spent, across all cohorts or filtered by individual learner.
Identify at-risk learners early
Spot learners falling behind through inactivity alerts and progress tracking. Act before disengagement becomes dropout.
Export data for stakeholder reporting
One-click CSV exports with attendance, grades, and completion data. Ready for compliance reports or internal reviews.
Analytics that cover the full picture.
From org-level dashboard to individual learner detail — visibility at every level.
Your entire academy at a glance.
Total learners, active courses, and completion rates — all in one view. Track weekly activity trends and monitor org-level health without switching between tools.
Deep-dive into every course.
See completion rates, average time, and learner status per course. Identify which courses drive engagement and which need attention — with progress bars that tell the story at a glance.
From group to individual in one click.
Start from the learner list, then drill into any individual to see their courses, scores, and last activity. Go from portfolio view to learner-level detail seamlessly.

Every score, every activity, every learner.
A structured grid showing scores across learners and activities. Track quiz results, assignment grades, and averages — with cell-by-cell visibility into performance.
Full visibility into every action.
Timestamped event log for security, compliance, and admin operations. See who logged in, who completed what, and who exported data — all in one timeline.
Analytics built for learning teams.
Tags, exports, and audit logs: everything you need for reporting.
Tag-based Segmentation
Segment insights by cohort, department, region, or custom tags to compare groups.
One-click Export
Export learner data, scores, and reports to CSV for compliance and stakeholder reporting.
Attendance Tracking
See who attended each session, how long they stayed, and which learners need follow-up, all in one view.
Fits into your stack.
Live delivery, embedded tools, and enterprise identity—connected where it matters.
“A modern learning platform that finally feels human”
“Not just an LMS, but a real learning community”
“Amazing support and true partnership”
“Finally a platform that our students actually enjoy using”
“The platform that helped us scale across 4 departments”
“Simple, modern, and very effective”
“Very easy to create and manage courses.”
All reviews are collected and hosted on G2.com.
Frequently asked questions
Learn more about LMS reporting and learning analytics.
Frameworks, KPIs, and benchmarks for measuring training ROI and learner outcomes.
New Analytics Dashboard
A redesigned analytics dashboard with deeper insight into completion, engagement, and outcomes.
New Gradebook for Progress Tracking
Track learner progress across every activity in one connected gradebook.
10 Effective Training KPIs
The metrics that matter for measuring corporate learning impact, and how to track them.
How to Measure ROI in Employee Training
A practical guide to quantifying training impact and proving value to leadership.
27 Must-Know LMS Statistics for 2026
The latest data on LMS adoption, engagement, and outcomes across industries.
98+ Employee Training Statistics
What the data says about employee training: completion rates, effectiveness, and impact.
New Analytics Dashboard
A redesigned analytics dashboard with deeper insight into completion, engagement, and outcomes.
New Gradebook for Progress Tracking
Track learner progress across every activity in one connected gradebook.
10 Effective Training KPIs
The metrics that matter for measuring corporate learning impact, and how to track them.
How to Measure ROI in Employee Training
A practical guide to quantifying training impact and proving value to leadership.
Explore more features.
Create engaging and interactive courses at scale.
Run cohorts, programs and academies, all in one platform. Start today.