
Completion rates are the most reported metric in learning management. They are also one of the least useful. A learner who clicks through every slide and passes a 10-question quiz has "completed" a course. That says nothing about whether they understood the material, retained it a month later, or changed how they work. Completion rate measures exposure to content, not the acquisition of skill or the application of knowledge.
Most learning management systems were built around content delivery. The reporting followed the same logic: track who accessed what, how long they spent, and whether they finished. These are logistics metrics. They tell you about activity, not outcomes. Organizations that rely on them are making strategic decisions about training investment based on data that cannot answer the question that matters: is anyone actually learning?
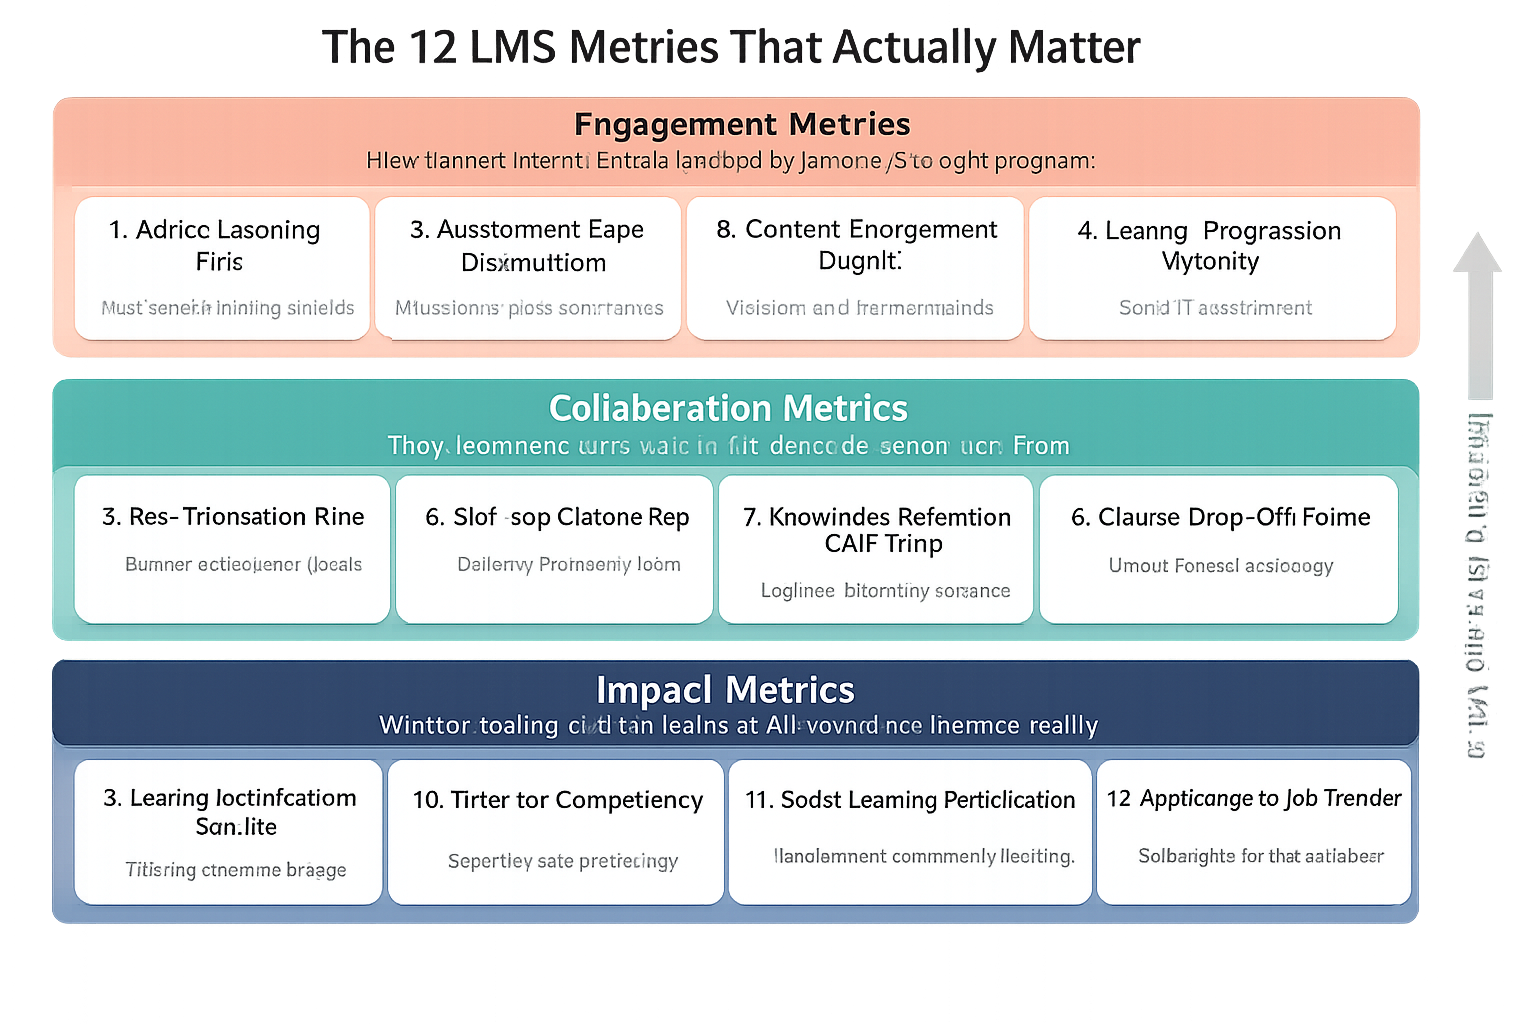
This guide covers 12 LMS metrics that go deeper. Each one measures a different dimension of learning effectiveness, from how learners engage with content to whether training changes on-the-job behavior. Together, they give L&D teams the data needed to improve programs rather than just report on them.
Why Traditional LMS Metrics Fall Short
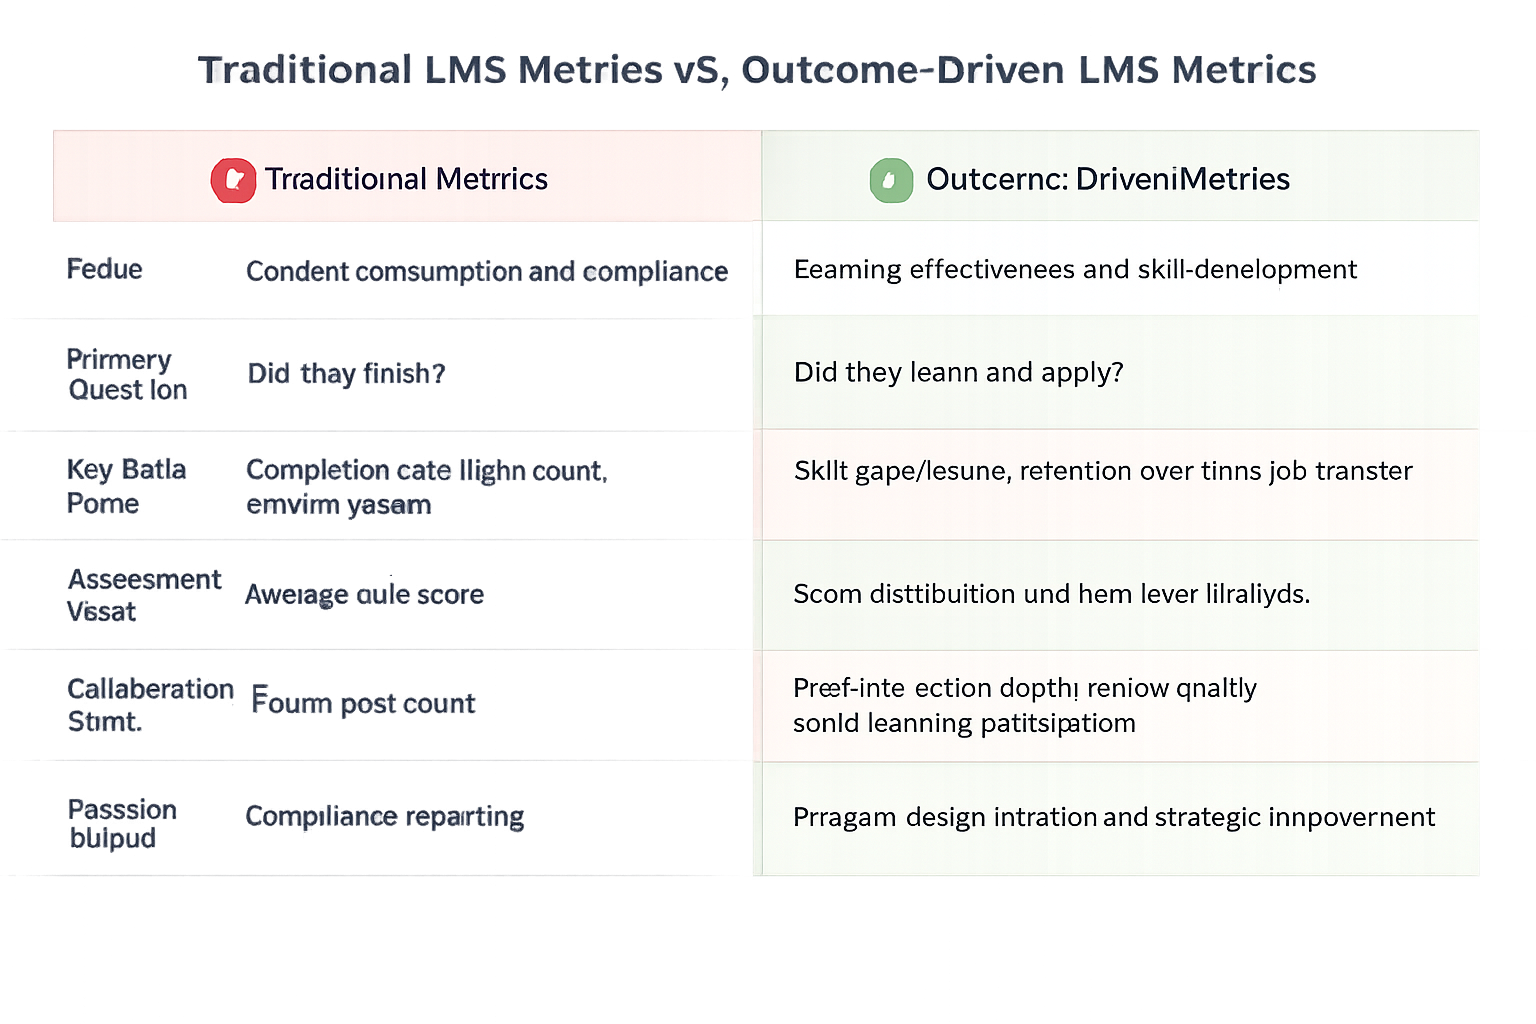
Traditional LMS reporting was designed for compliance. The original question was simple: did the employee complete the required training? For regulatory and legal purposes, that question still matters. But organizations now use their LMS for skill development, onboarding, leadership training, and continuous professional growth. Compliance metrics cannot evaluate those programs.
The standard dashboard in most platforms reports completion rates, average quiz scores, login frequency, and time spent in the system. These are all input metrics. They describe learner activity but reveal nothing about learning outcomes. A 90% completion rate could mean the training was effective, or it could mean the content was easy to click through. An average quiz score of 85% could reflect genuine understanding, or it could reflect poorly written questions that everyone guesses correctly.
The deeper problem is that traditional metrics encourage the wrong optimization. When completion rate is the target, course designers shorten content, simplify assessments, and remove friction. The numbers improve while the learning gets worse. When time-in-system is the benchmark, learners leave modules running in background tabs. The metric goes up while engagement goes down.
Moving beyond these surface-level numbers requires tracking what happens during the learning process and, critically, what happens after it. The 12 metrics that follow are organized around that principle.
The 12 LMS Metrics That Actually Matter
Active Learning Time
What it measures: The amount of time learners spend actively engaging with content, as opposed to passive exposure. Active learning time tracks interactions like answering questions, completing exercises, annotating materials, participating in discussions, and producing deliverables. It excludes time spent with a video playing in the background or a page open but idle.
Why it matters: Total time in the LMS is a vanity metric. Two learners can each log 45 minutes in a module, but if one spent 30 of those minutes working through a case study while the other had the tab open during lunch, their experiences were fundamentally different. Active learning time separates genuine engagement from passive presence. It correlates more closely with retention and skill development than raw session duration.
How to act on it: Compare active learning time across modules to identify where engagement drops. If learners are active for 80% of Module 1 but only 40% of Module 3, the content or format in Module 3 likely needs redesign. Use active learning time alongside assessment performance to determine whether more engagement actually produces better outcomes. If it does not, the activities themselves may need rethinking.
Assessment Score Distribution
What it measures: The spread of scores across an assessment, not just the average. Score distribution reveals whether most learners cluster around the same result, whether there is a wide variance, and whether the assessment differentiates between levels of understanding.
Why it matters: An average score of 78% tells you almost nothing. If every learner scored between 75% and 81%, the assessment lacks discrimination and likely tests surface-level recall. If scores range from 40% to 95%, the assessment is capturing real differences in comprehension. Competency assessment depends on instruments that can distinguish between learners who genuinely understand material and those who memorized just enough to pass.
How to act on it: Analyze item-level performance within assessments. Questions where nearly everyone scores correctly are too easy and should be replaced or removed. Questions where nearly everyone fails may be poorly worded, or they may reveal a genuine knowledge gap that the preceding content did not address. Use distribution data to calibrate difficulty and ensure assessments measure understanding, not recall.
Content Engagement Depth
What it measures: How deeply learners interact with specific content elements. This goes beyond "opened the page" to track behaviors like replaying video segments, expanding supplementary resources, downloading reference materials, revisiting previous modules, and scrolling patterns within long-form content.
Why it matters: Surface-level engagement looks the same for everyone on a completion report. Depth metrics reveal which learners are genuinely studying versus skimming. They also reveal which content elements are compelling enough to warrant deeper exploration and which are being skipped entirely. This data is essential for instructional design improvement.
How to act on it: Identify content segments with unusually high replay rates. These often indicate either high-value material that learners want to review or confusing material they need to watch again to understand. Cross-reference with assessment performance to determine which interpretation is correct. Remove or condense content with consistently low depth engagement. Expand or reformat content that drives high interaction.
Learner Progression Velocity
What it measures: The rate at which learners move through a course or program relative to the expected timeline. This includes time between module completions, pace relative to cohort averages, and acceleration or deceleration patterns over the duration of a program.
Why it matters: Progression velocity reveals whether course pacing matches learner capacity. Learners who race through content may not be engaging deeply. Learners who stall at specific points may be hitting difficulty spikes or losing motivation. Across a cohort, velocity patterns expose structural problems in course design that individual completion data cannot reveal.
How to act on it: Map velocity curves for the full learner population. Identify common stall points where progression slows significantly. These are candidates for additional support, content revision, or checkpoint interventions. If fast movers consistently perform well on assessments, the course may benefit from optional advanced tracks. If slow movers drop out at predictable points, those points need redesign or additional scaffolding.
Peer Interaction Rate
What it measures: The frequency and quality of interactions between learners within the LMS. This includes discussion posts, replies, peer review submissions, collaborative project contributions, and informal knowledge sharing in community spaces.
Why it matters: Learning is not a solo activity. Research on peer learning consistently shows that learners who interact with peers retain more, develop deeper understanding, and complete programs at higher rates. Peer interaction rate measures whether your platform and program design are creating the conditions for collaborative learning or whether learners are progressing in isolation.
How to act on it: Track interaction rates across different program elements. If discussion participation is high but peer review completion is low, the review process may be too burdensome or poorly structured. If overall interaction is low, examine whether the program design actually requires collaboration or merely offers it as an option. Required, structured peer interaction with clear guidelines consistently outperforms optional discussion forums.
Skill Gap Closure Rate
What it measures: The rate at which identified skill gaps narrow over time. This requires a baseline assessment at program entry, periodic re-assessment during the program, and a post-program evaluation. The metric tracks the delta between initial skill level and current demonstrated competency for each target skill.
Why it matters: This is one of the most direct measures of training effectiveness. It answers the core question: are learners developing the specific skills this program was designed to build? Unlike completion rates, which measure process, skill gap closure measures outcome. It is central to any training needs analysis framework and allows organizations to quantify return on training investment.
How to act on it: Segment skill gap closure data by skill area, learner cohort, and program module. If certain skills show strong closure rates while others stagnate, the content or practice opportunities for stagnant skills need revision. Compare closure rates across different program formats (self-paced versus cohort-based, for example) to identify which delivery methods produce better outcomes for different skill types.
Knowledge Retention Over Time
What it measures: How well learners retain information and skills after the initial training period. This requires follow-up assessments administered at intervals, typically 30, 60, and 90 days after program completion, using questions that test the same competencies as the original assessments.
Why it matters: The forgetting curve is real. Without reinforcement, learners lose a significant portion of new knowledge within weeks. A program that produces high scores at completion but poor retention at 60 days has not achieved its goal. Retention data reveals whether training creates lasting capability or temporary knowledge that fades quickly. Understanding this pattern is a core concern of the Kirkpatrick model of training evaluation.
How to act on it: If retention drops sharply at the 30-day mark, add spaced repetition or reinforcement activities in the weeks following completion. If certain topics retain well while others decay rapidly, prioritize post-training reinforcement for the weaker areas. Use retention data to advocate for ongoing learning support rather than one-time training events. Programs with built-in reinforcement consistently show better long-term retention than those that end abruptly.
Course Drop-Off Points
What it measures: The specific locations within a course where learners disengage, slow down significantly, or abandon the program entirely. This is a granular version of dropout rate, mapped to exact content modules, activities, or transitions.
Why it matters: Overall dropout rate tells you that learners are leaving. Drop-off point analysis tells you where and, with additional investigation, why. A course with a 40% dropout rate might have a single bottleneck module where 35% of those dropouts occur. Fixing that one point could transform the entire program's retention numbers.
How to act on it: Create a drop-off heat map across the full course timeline. Investigate modules or activities with disproportionate attrition. Common causes include difficulty spikes, unclear instructions, excessive length, or transitions between content types that confuse learners. A/B test redesigned versions of high-attrition sections. Track whether changes reduce drop-off without lowering assessment performance in subsequent modules.
Learner Satisfaction Scores
What it measures: Learner perception of training quality, relevance, and experience. Collected through post-module or post-program surveys, satisfaction scores capture subjective feedback on content value, instructor effectiveness, platform usability, and perceived applicability to the job.
Why it matters: Satisfaction is not a proxy for learning effectiveness, but it is a leading indicator of employee engagement with training programs. Learners who find training irrelevant or frustrating will disengage from future programs regardless of quality improvements. Satisfaction data also surfaces practical problems (confusing navigation, unclear instructions, technical issues) that may not appear in other metrics.
How to act on it: Break satisfaction scores into specific dimensions rather than relying on a single overall rating. Track content relevance separately from platform usability, instructor quality separately from peer interaction quality. Correlate satisfaction with performance data to identify which satisfaction drivers actually predict better results. Prioritize the low-satisfaction areas that also correlate with poor outcomes, since fixing those addresses both learner experience and training impact at once.
Time-to-Competency
What it measures: The elapsed time from program start to the point where a learner demonstrates competency at a predefined standard. Competency is measured through assessments, practical demonstrations, or supervisor evaluations, not by course completion alone.
Why it matters: Two programs might both produce competent employees, but if one does it in three weeks and the other in eight, the faster program delivers more value. Time-to-competency is a critical efficiency metric for onboarding, role transitions, and employee training programs where speed matters. It also reveals whether your learning path is optimally designed or contains unnecessary content that extends the timeline without improving outcomes.
How to act on it: Benchmark time-to-competency across cohorts, roles, and program versions. If new hires in one department reach competency faster than those in another with the same training, investigate whether the difference is in learner preparation, manager support, or program fit. Use the metric to justify streamlining programs that achieve the same competency outcomes with less content. Track changes in time-to-competency when you modify program design to validate whether improvements are working.
Social Learning Participation
What it measures: The extent to which learners engage in informal and structured social learning activities within the platform. This includes participation in community discussions, contributions to shared knowledge bases, mentoring interactions, group project collaboration, and responses to peer questions outside of formal course activities.
Why it matters: Formal content delivers concepts; social learning builds judgment. When learners share real-world examples, debate approaches, and work through problems together, they develop contextual understanding that pre-built modules rarely surface on their own. Low participation in social learning activities is often a signal that these elements were added to the program rather than designed into it, offered as optional enrichment rather than built as load-bearing parts of the learning experience.
How to act on it: Distinguish between required and voluntary social participation. If required activities (peer reviews, group projects) have high participation but voluntary activities (community discussions, knowledge sharing) do not, focus on creating better incentive structures and demonstrating value for voluntary engagement. Track whether learners who participate in social learning show better assessment performance and retention. Use this data to make the case for embedding social learning more deeply into program design.
Application-to-Job Transfer Indicators
What it measures: Evidence that knowledge and skills acquired during training are being applied in actual work contexts. This can be measured through manager assessments, work product evaluation, performance metric changes, self-reported application surveys, and observable behavior change on the job.
Why it matters: This is the metric that connects training to business outcomes. Every other metric on this list measures something that happens during or immediately after the learning experience. Application-to-job transfer measures whether training actually changed how people work. Without this metric, an organization cannot determine whether its training investment produced value. How to improve corporate training ultimately comes down to whether the training transfers.
How to act on it: Design transfer measurement into the program from the start, not as an afterthought. Include post-training check-ins at 30 and 90 days where learners report on application attempts. Engage managers in evaluating whether trained skills are visible in work performance. Correlate transfer data with specific program elements to identify which activities best prepare learners for real-world application. Programs that include practice scenarios mirroring actual job tasks consistently show higher transfer rates than those that teach concepts abstractly.
How Modern LMS Platforms Track These Metrics
Legacy LMS platforms were not designed to capture most of these metrics. They track completions, quiz scores, and login timestamps because those were the metrics that mattered in a compliance-driven model. Measuring active learning time, peer interaction depth, or skill gap closure requires a fundamentally different data architecture.
Modern platforms approach analytics differently. They instrument the learning experience at a granular level, capturing interaction patterns, collaboration behaviors, and progression dynamics rather than just content access events. They make it possible to move from "who finished" to "who learned" and "who applied what they learned."
Platforms like Teachfloor, built around collaborative and cohort-based learning, are designed to capture metrics like peer interaction rate, social learning participation, and skill progression natively. When collaboration is a structural part of the learning experience rather than an add-on feature, the data about how learners interact with each other becomes a natural byproduct of the platform's design.
The shift from legacy to modern analytics is not just a technology upgrade. It reflects a change in what organizations consider important. When the platform is designed to track learning effectiveness rather than content consumption, reporting becomes a tool for improvement rather than a compliance artifact.
Turning Metrics Into Strategic Decisions
Collecting these 12 metrics is necessary but not sufficient. The value comes from turning data into decisions that improve training outcomes. Here is how to structure that process.
Establish baselines before optimizing. Measure each metric for at least one full program cycle before drawing conclusions. Single data points mislead. Trends over multiple cohorts reveal genuine patterns. Baseline data for each metric gives you the foundation for meaningful comparison when you make changes.
Connect metrics to business objectives. Not every metric carries equal weight for every program. An onboarding program should prioritize time-to-competency and application-to-job transfer. A leadership development program might weight peer interaction rate and social learning participation more heavily. Align your metric priority with the specific learning outcomes each program targets.
Build feedback loops between metrics and design. When drop-off analysis reveals a bottleneck module, redesign it and measure whether the change improves both retention and downstream assessment performance. When skill gap closure rates stagnate for a particular competency, revise the practice activities and reassess. Metrics should trigger design iterations, not just populate dashboards.
Report at the right altitude. Executives need application-to-job transfer and time-to-competency data tied to business outcomes. Program designers need content engagement depth and drop-off point analysis. Facilitators need peer interaction rates and satisfaction scores. Each audience needs a different slice of the data, presented in the context of decisions they can make.
Combine quantitative and qualitative signals. Numbers tell you what is happening. Learner interviews, open-ended survey responses, and facilitator observations tell you why. A drop in satisfaction scores is a data point. A learner explaining that the peer review process felt unclear is an actionable insight. The most effective L&D teams use both.
The organizations that get the most value from LMS metrics are those that treat them as inputs to a continuous improvement cycle rather than outputs for a quarterly report. Each metric illuminates a different aspect of training impact, and using them together surfaces patterns that no single number can show.
Final Thoughts
The shift from completion-based reporting to outcome-driven analytics is not a technology problem. It is a mindset change. Most organizations already have more data than they use. The challenge is knowing which data matters, how to interpret it, and what to do about it.
The 12 metrics outlined here span the full learning lifecycle, from initial engagement through long-term application on the job. What they share is a focus on what learners actually do and demonstrate, rather than what they click through. Used together, they give L&D teams enough signal to diagnose problems, test fixes, and build programs that produce results that show up outside the LMS.
Start with whichever metrics your current platform supports. Add measurement capabilities incrementally as you upgrade systems or adopt new tools. The goal is not to track everything from day one. The goal is to stop relying on completion rates as the primary indicator of training success and begin measuring what actually matters: whether people are learning, retaining, and applying new skills in their work.


