New Analytics Dashboard
We are introducing the new Analytics section in Teachfloor, a central hub that brings together all the data you need to understand and manage your organization’s learning performance. With dashboards, detailed course reports, learner insights, and activity logs, you now have a 360-degree view of how your courses and students are performing.
A smarter dashboard for organizational data
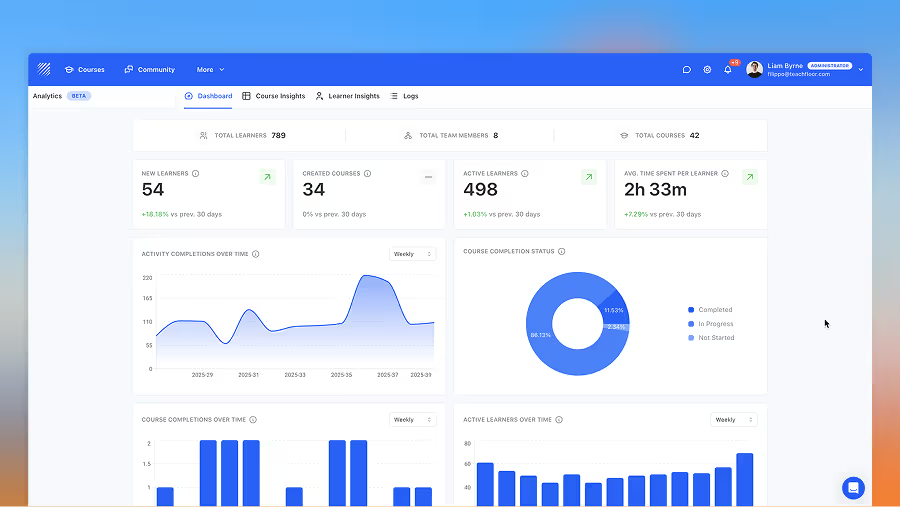
The Analytics Dashboard gives you an at-a-glance overview of key metrics. It helps you spot trends, track progress, and measure engagement across your organization. You will find:
- Course completion status charts (completed, in progress, not started)
- Activity completions over time with weekly tracking
- Active learners and new courses, compared to previous periods
- Metrics that help you identify changes and patterns across time
This high-level view helps you keep track of organizational health and see how learning evolves over time.
Course insights with detailed breakdowns
The Course Insights tab provides a deeper look at performance for each course. You can quickly check:
Course status and tags
- How many learners are not started, in progress, or completed
- Course type, completion dates, and average score across learners
When you click on a specific course, you can go further and access detailed learner-level data, including:
- Name and learner tags
- Enrollment status
- Completion percentage
- Start and completion dates
- Average score
This makes it easy to understand how courses are performing and where learners may need additional support.
A complete overview of learners
The Learner Insights tab shifts the focus to individual learners, giving you a complete overview of their engagement. For each learner, you can see:
Join date and last active date
- Number of completed and enrolled courses
- Total time spent on the platform
These insights help you evaluate participation patterns, highlight success stories, and identify learners who may require more attention.
Logs for complete transparency
The Logs tab provides a clear record of all learner events, updated daily for accuracy. This includes:
- Logins and logouts
- Course enrollments
- Activity completions
Having this level of detail creates transparency, ensures accountability, and helps you better understand user behavior across your organization.
Why the Analytics section matters
With this release, administrators and instructors gain powerful tools to:
- Monitor progress and engagement across all levels
- Identify trends in course adoption and learner participation
- Measure learning outcomes with completion data and scores
- Provide targeted support to learners who are falling behind
- Report results effectively to stakeholders and leadership
Available now
The Analytics section is already available in your Teachfloor dashboard under the Analytics tab. With these tools, you can make data-driven decisions, improve your training programs, and measure the real impact of learning in your organization.


