
What Is the Inception Score?
The inception score (IS) is a quantitative metric used to evaluate the quality and diversity of images produced by generative models.
It was introduced in 2016 alongside the development of improved training techniques for generative adversarial networks (GANs), and it quickly became one of the first widely adopted benchmarks for assessing synthetic image output.
The metric works by feeding generated images through a pretrained convolutional neural network called Inception v3, which was originally designed for image recognition on the ImageNet dataset.
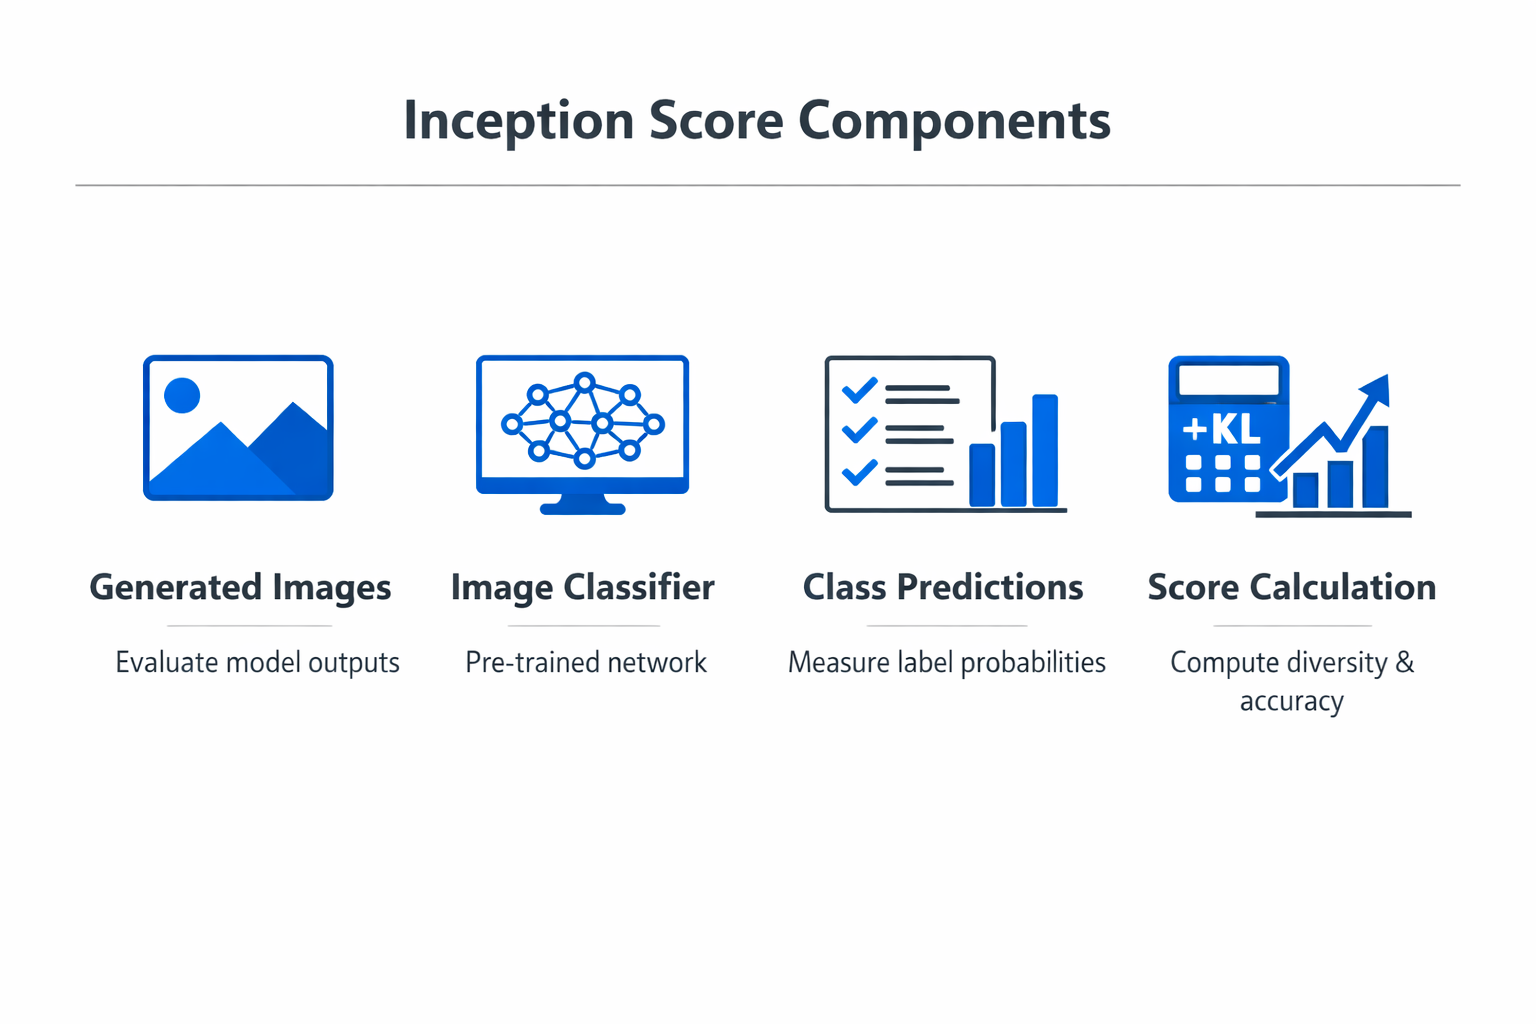
The inception score uses the classification outputs from this network to measure two properties simultaneously: whether individual images look like clear, recognizable objects (quality), and whether the full set of generated images spans a wide range of categories (diversity). A high inception score indicates that the generative model produces sharp, identifiable images across many different classes. A low score suggests the images are either blurry, ambiguous, or repetitive.
The inception score is expressed as a single number, typically on a scale that can range from 1 to the total number of classes in the Inception network's training set. In practice, scores for generative models on ImageNet benchmarks tend to fall between 1 and about 300, with higher values indicating better performance. The theoretical maximum reflects a model that generates perfectly recognizable images spread uniformly across all 1,000 ImageNet categories.
The metric takes its name directly from the Inception v3 network used in its computation. The Inception architecture, developed by Google, was a high-performing deep learning model for image classification. Using the classification confidence of this pretrained network, the inception score gives an automated, reproducible way to evaluate generative output without human judges.
How the Inception Score Works
The inception score relies on a specific statistical relationship between two probability distributions derived from the Inception v3 classifier. Understanding the metric requires following the logic of how these distributions are constructed and compared.
Step 1: Classify Generated Images
Each synthetic image is passed through the pretrained Inception v3 neural network. The network outputs a conditional probability distribution p(y|x), which represents the model's confidence that image x belongs to each of the 1,000 ImageNet classes. A high-quality image produces a distribution that is sharply peaked around one class, indicating the classifier is confident about what it sees.
A blurry, noisy, or ambiguous image produces a flatter distribution, meaning the classifier cannot determine a clear category.
Step 2: Compute the Marginal Distribution
After classifying all generated images individually, the inception score computes the marginal class distribution p(y) by averaging the conditional distributions across the entire set of generated samples. This marginal distribution reflects how the generated images are spread across different categories. If the generative model produces a wide variety of distinct object types, p(y) will be roughly uniform across many classes.
If the model suffers from mode collapse, a common problem in generative adversarial network training where the generator produces only a narrow subset of possible outputs, p(y) will be concentrated on a few classes.
Step 3: Measure the KL Divergence
The inception score quantifies the gap between these two distributions using the Kullback-Leibler (KL) divergence. Specifically, it computes the KL divergence from the marginal p(y) to each conditional p(y|x), then averages this value across all generated images. The KL divergence is high when the conditional distributions (sharp, confident predictions for individual images) differ significantly from the marginal distribution (broad, uniform spread across classes).
This high divergence is the desired outcome because it means each individual image is clearly recognizable while the overall collection covers many different categories.
Step 4: Exponentiate the Result
The final inception score is obtained by exponentiating the average KL divergence. This transformation converts the information-theoretic quantity (measured in nats or bits) into a more interpretable scale. The resulting number can be loosely understood as the effective number of distinct categories the model generates with high confidence. A score of 100, for instance, suggests the model reliably produces sharp images spanning roughly 100 recognizable object categories.
The Mathematical Formulation
The formal expression for the inception score is:
IS = exp(E_x [KL(p(y|x) || p(y))])
Here, E_x denotes the expectation over generated images, KL represents the Kullback-Leibler divergence, p(y|x) is the classifier's output for a single image, and p(y) is the averaged distribution over all generated images. The exponential function converts the divergence into the final score. This formula captures both quality (through the sharpness of p(y|x)) and diversity (through the breadth of p(y)) in a single computation.
| Component | Function | Key Detail |
|---|---|---|
| Classify Generated Images | Each synthetic image is passed through the pretrained Inception v3 neural network. | The network outputs a conditional probability distribution p(y/x) |
| Compute the Marginal Distribution | After classifying all generated images individually. | — |
| Measure the KL Divergence | The inception score quantifies the gap between these two distributions using the. | The KL divergence is high when the conditional distributions (sharp |
| Exponentiate the Result | The final inception score is obtained by exponentiating the average KL divergence. | — |
| The Mathematical Formulation | The formal expression for the inception score is: IS = exp(E_x [KL(p(y/x) // p(y))]) Here. | The exponential function converts the divergence into the final score |
Why the Inception Score Matters
The inception score holds historical significance as one of the first automated metrics for evaluating generative AI outputs. Before its introduction, evaluating generative models relied heavily on qualitative human judgment, which is slow, expensive, and difficult to reproduce across different research groups.
The inception score provided a standardized, computable benchmark that allowed researchers to compare models on equal footing.
This standardization accelerated progress in generative modeling. Research teams could report inception scores alongside generated samples, enabling the community to track improvements over time. The metric became a default reporting standard for GAN research papers, and improvements in inception scores served as evidence that new architectures and training techniques were genuinely producing better results.
The inception score also matters because it encodes two distinct quality dimensions in a single number. A generative model that produces extremely realistic images of only one category will score poorly because the marginal distribution will be narrow. Likewise, a model that produces diverse but unrecognizable outputs will also score poorly because the conditional distributions will be flat. Only models that achieve both realism and variety earn high scores.
For practitioners working with machine learning systems, the inception score provides a quick sanity check during model development. When experimenting with different hyperparameters, architectures, or training procedures, tracking the inception score over training runs offers a quantitative signal about whether changes are improving or degrading output quality.
This is especially valuable in the context of GAN training, where visual inspection of a few cherry-picked samples can be misleading.
The metric also influenced the design of later evaluation methods. The Frechet Inception Distance (FID), which has largely superseded the inception score as the primary generative evaluation metric, was developed in direct response to its limitations. Understanding the inception score is therefore essential context for the wider field of generative model evaluation.
Inception Score Use Cases
Benchmarking GAN Architectures
The most common application of the inception score is comparing different GAN architectures on standard datasets. When researchers propose a new generator design, discriminator modification, or training stabilization technique, they typically report inception scores on benchmarks like ImageNet or CIFAR-10. This allows direct numerical comparison with previous methods and establishes whether the proposed change represents a genuine improvement.
The inception score was central to the evaluation of landmark GAN architectures including DCGAN, WGAN, Progressive GAN, and BigGAN. Each of these models reported inception scores as part of their results, and the upward trajectory of scores over time served as evidence of real progress in generative modeling with deep learning.
Monitoring Training Progress
During GAN training, the inception score can be computed at regular intervals to track whether the generator is improving. Because GAN training does not have a single loss value that reliably correlates with output quality, external evaluation metrics like the inception score fill an important gap. A rising inception score during training suggests the generator is learning to produce more recognizable and diverse images. A plateau or decline can signal training instability, mode collapse, or overfitting.
This monitoring use case is practical for teams developing custom generative models with frameworks like PyTorch. Automated evaluation pipelines can compute the inception score periodically and flag runs that are underperforming relative to baselines, reducing the need for manual visual inspection of generated samples.
Hyperparameter Selection
Generative models are sensitive to hyperparameter choices, including learning rate, batch size, latent space dimensionality, and architectural details. The inception score provides an objective criterion for selecting among candidate configurations. By evaluating each configuration's inception score on a held-out generation run, practitioners can identify settings that produce the best balance of quality and diversity.
This approach is especially relevant in unsupervised learning settings where there is no labeled validation set to compute accuracy on. The inception score serves as a proxy objective for model selection when ground-truth labels are unavailable or irrelevant.
Evaluating Diffusion Models and VAEs
Although the inception score was originally developed for GANs, it applies to any generative model that produces images. Diffusion models and variational autoencoders (VAEs) are also evaluated using the inception score, particularly in comparative studies that benchmark different generative paradigms against each other.
In practice, diffusion models often achieve higher inception scores than GANs on the same datasets, reflecting their superior ability to produce both high-quality and diverse outputs. VAEs tend to score lower due to the blurriness that characterizes their outputs, a direct consequence of the reconstruction loss that smooths fine details. These comparisons have been instrumental in shifting the field's attention from GANs toward diffusion architectures.
Evaluating Text-to-Image Systems
Text-to-image models such as DALL-E and Stable Diffusion are sometimes evaluated using the inception score, though these systems are more commonly assessed with FID and human evaluation. When the inception score is applied to text-to-image systems, it measures the recognizability and variety of the generated outputs without considering whether those outputs match the input prompts.
This limitation makes the inception score a partial evaluation tool for conditional generation. It confirms that the model produces clear, varied images but says nothing about prompt faithfulness. To fully evaluate text-to-image systems, the inception score is typically paired with other metrics.
Challenges and Limitations
Dependence on the Inception Network
The inception score is fundamentally constrained by the Inception v3 classifier it relies on. This network was trained on ImageNet, a dataset of 1,000 object categories drawn from everyday photographs. Images that fall outside the ImageNet distribution, such as medical scans, satellite imagery, abstract art, or architectural drawings, may be poorly classified by the Inception network even if they are high-quality outputs from a generative model.
This means the inception score is not a general-purpose image quality metric. It works well for evaluating models trained on natural images that overlap with ImageNet categories. For specialized domains, the score can be misleading because the classifier lacks the relevant knowledge to assess whether the generated images are realistic.
No Comparison to Real Data
The inception score evaluates generated images in isolation. It does not compare the distribution of generated images to the distribution of real training images. A model that produces sharp, diverse images of categories not present in the training data could receive a high inception score while completely failing to capture the intended data distribution.
This limitation was the primary motivation for developing the Frechet Inception Distance, which explicitly compares the statistics of generated images to those of real images. FID captures distributional fidelity in a way the inception score cannot, which is why FID has become the more commonly reported metric in recent generative modeling research.
Insensitivity to Intra-Class Quality
The inception score rewards images that are confidently classified into distinct categories, but it does not assess fine-grained quality within a category. A model that generates recognizable but low-resolution dogs will score similarly to a model that generates photorealistic dogs, as long as the Inception classifier is equally confident in both cases. This ceiling effect means the inception score may not distinguish between good and excellent generators operating within the same quality range.
Mode Dropping and Memorization
The inception score measures diversity through the marginal distribution p(y) but does not check whether the generated images are novel. A model that memorizes and reproduces training images verbatim could achieve a high inception score if the memorized images are diverse and recognizable. Similarly, a model that drops several modes but covers many others might still score well, masking the loss of certain categories from the generated distribution.
Sample Size Sensitivity
The inception score is sensitive to the number of images used in its computation. Small sample sizes produce high variance estimates, making it difficult to draw reliable conclusions from limited generation runs. The original paper recommended using at least 50,000 generated images and reporting the mean and standard deviation across multiple evaluation splits. Failure to follow this protocol can lead to inflated or unstable scores.
Bias Toward ImageNet Characteristics
Because the Inception network was trained on ImageNet, the inception score implicitly favors images that share visual characteristics with the ImageNet dataset. This includes natural photographs with centered objects, standard lighting, and common compositions. Generative models producing images with different visual properties, such as stylized illustrations, textures, or scenes without central objects, may receive lower scores regardless of their actual quality.
How to Calculate the Inception Score
Calculating the inception score involves a straightforward computational pipeline. The following steps outline the standard procedure used in research and production evaluation settings.
Prerequisites
Before computing the inception score, you need:
- A pretrained Inception v3 model, typically loaded from a standard deep learning framework like PyTorch or TensorFlow
- A set of generated images, ideally at least 50,000 samples for a statistically reliable estimate
- Images resized to 299x299 pixels, the input resolution expected by Inception v3
Step-by-Step Procedure
- Generate a large batch of images from the model being evaluated. Store these images as tensors or files that can be loaded into the classification network.
- Preprocess each image by resizing to 299x299 pixels and normalizing pixel values according to the Inception v3 preprocessing requirements.
- Pass each image through the Inception v3 network and extract the softmax output, which represents the conditional distribution p(y|x) over 1,000 ImageNet classes.
- Compute the marginal distribution p(y) by averaging all conditional distributions across the full set of generated images.
- For each image, calculate the KL divergence between its conditional distribution p(y|x) and the marginal distribution p(y).
- Average the KL divergence values across all images.
- Exponentiate the average KL divergence to obtain the final inception score.
- Split the generated images into multiple subsets (commonly 10 splits), compute the inception score for each split, and report the mean and standard deviation. This split-based protocol reduces the impact of statistical noise and provides confidence intervals for the estimate.
Practical Considerations
Several implementation details affect the reliability of the computed score. Using a different version of the Inception network or a different preprocessing pipeline will produce different scores, making results incomparable across setups. The research community has standardized on the TensorFlow implementation of Inception v3 with specific weight checkpoints, and deviating from this standard is a common source of discrepancy.
The number of generated samples matters significantly. Computing the inception score on fewer than 10,000 images produces noisy, unreliable estimates. The standard recommendation of 50,000 samples with 10-way splitting provides a stable estimate that enables meaningful comparison between models.
Teams building evaluation pipelines for artificial intelligence projects should note that the inception score computation is relatively inexpensive. Running 50,000 images through Inception v3 takes minutes on a modern GPU, making it feasible to evaluate models frequently during training.
Libraries such as torchmetrics and tensorflow-gan provide reference implementations that handle the details of preprocessing, classification, and score computation.
Interpreting the Score
The inception score is most useful as a relative comparison. Absolute values are meaningful only within the context of a specific dataset and evaluation protocol. A score of 200 on ImageNet generation is strong by historical GAN standards, while current diffusion models can exceed 300. On smaller or less complex datasets like CIFAR-10, the maximum achievable score is lower because there are only 10 classes.
When reporting inception scores, always specify the number of generated samples, the number of evaluation splits, the exact Inception model checkpoint used, and the preprocessing procedure. This metadata ensures other researchers can reproduce and fairly compare results. Without this context, inception score values are difficult to interpret and compare across papers.
The inception score is best understood as one component in a broader evaluation toolkit. Pairing it with the Frechet Inception Distance, precision and recall metrics for generative models, and qualitative human evaluation provides a more complete picture of a generative model's capabilities and limitations.
FAQ
What is a good inception score?
A good inception score depends entirely on the dataset and the class of generative model being evaluated. On ImageNet, early GANs achieved scores around 10 to 30. Improved architectures like BigGAN pushed scores above 150. State-of-the-art diffusion models have reached scores above 300 on the same benchmark.
On CIFAR-10, which has only 10 classes, scores above 9 are considered strong because the theoretical maximum is limited by the small number of categories. Comparing inception scores is only meaningful when models are evaluated on the same dataset using the same protocol.
How is the inception score different from FID?
The inception score evaluates generated images in isolation, measuring whether they are individually recognizable and collectively diverse. The Frechet Inception Distance (FID) compares the statistical distribution of generated images to the distribution of real images, measuring how closely the generated set matches the real training data.
FID is generally considered a more informative metric because it accounts for distributional similarity, while the inception score does not reference real data at all. Most modern research reports both metrics, though FID receives greater emphasis in evaluation.
Can the inception score detect mode collapse?
The inception score provides partial detection of mode collapse. If a model generates images from only a few categories, the marginal distribution p(y) will be narrow, reducing the KL divergence and lowering the score. Severe mode collapse, where the generator produces only one or two types of images, will be reflected in a noticeably low inception score.
Subtle mode dropping, where the model covers most categories but misses a few, may not significantly affect the score because the marginal distribution can still appear broadly distributed.
Does the inception score work for non-image generative models?
The standard inception score applies only to image generation because it depends on the Inception v3 image classifier. It cannot be directly used to evaluate text generators, audio synthesizers, or other non-visual generative AI systems.
Researchers have proposed analogous metrics for other domains, such as the Frechet Audio Distance for audio and perplexity-based scores for text, but these are distinct metrics with their own formulations rather than adaptations of the inception score.
Why is it called the inception score?
The name comes from the Inception v3 neural network used to compute the metric. The Inception architecture was developed by Google and achieved strong results on the ImageNet Large Scale Visual Recognition Challenge.
The creators of the inception score chose this particular network because it was a high-performing, well-understood image classifier that provided reliable confidence estimates across a large number of object categories. The "Inception" name itself originates from the network architecture's use of inception modules, which process input through parallel convolutional filters of different sizes.
Is the inception score still used today?
The inception score is still reported in some generative modeling research, but its role has diminished relative to other metrics. The Frechet Inception Distance has become the more commonly cited metric due to its ability to compare generated and real data distributions. Precision and recall metrics for generative models, CLIP-based scores, and human evaluation have also gained prominence.
The inception score remains useful as a supplementary metric and retains value for historical comparison with earlier generative models.


